A risk heat map is useful only when it changes what people do next. In cybersecurity, teams can drown in scanner findings, cloud misconfigurations, identity alerts, and third party issues while the real business risk stays untouched. A well built cyber risk heat map solves a different problem than reporting. It gives leaders a shared view of what matters now, what is moving, and what needs a decision.
This article shows how to build a risk heat map that holds up in real discussions with engineering, security, and executives. It focuses on inputs you can defend, scoring you can explain, and outputs that translate into action. Whether your organization writes cyber security, cybersecurity, or even sybersecurity in internal tickets, the logic must stay consistent.
What a Risk Heat Map Does in Cybersecurity
A risk heat map plots risks on a grid using likelihood and impact. The map is not a prediction engine. It is a prioritization surface that forces tradeoffs into the open.
The most common failure is building a beautiful chart that does not answer a human question. A board member wants to know what can hurt revenue, customers, and compliance in the next quarter. A service owner wants to know which change will reduce risk fastest. A security lead wants to know where the program is stuck.
A practical heat map does three things. It ranks work. It makes risk acceptance visible. It makes ownership unavoidable.
Likelihood and Impact That Hold Up
Likelihood should not be a synonym for vulnerability severity. Impact should not be a synonym for technical inconvenience. Both must map to language that business and engineering can share.
Likelihood in cyber risk works best as a blend of exposure, feasibility, and control strength. Exposure asks whether the attack path is reachable. Feasibility asks what an attacker needs to succeed. Control strength asks whether identity, monitoring, and hardening reduce the chance of success.
Impact should reflect business outcomes. Downtime matters when it interrupts a service customers pay for or when it triggers contractual penalties. Data loss matters when it involves regulated or high trust data. Operational disruption matters when it blocks shipping, care delivery, or trading.
Use a 5 by 5 grid to avoid both oversimplification and false precision. Keep the scoring definitions stable and publish them in the same place where teams file risk work.
A Risk Heat Map Scoring Rubric You Can Defend
| Score | Likelihood in a cyber context | Impact in a cybersecurity context |
|---|---|---|
| 1 | Attack path is unlikely to be reached and controls are strong | Minor localized effect with no meaningful customer or compliance impact |
| 2 | Attack path exists under specific conditions and controls reduce success | Limited disruption or cost contained within one team or small service area |
| 3 | Attack path is plausible and current controls leave gaps | Noticeable customer impact or reportable operational disruption |
| 4 | Attack path is likely given current exposure or weak identity controls | Major disruption, material financial impact, or significant regulatory consequence |
| 5 | Attack path is expected without change and defenses are insufficient | Severe business interruption or existential risk to trust, license, or continuity |
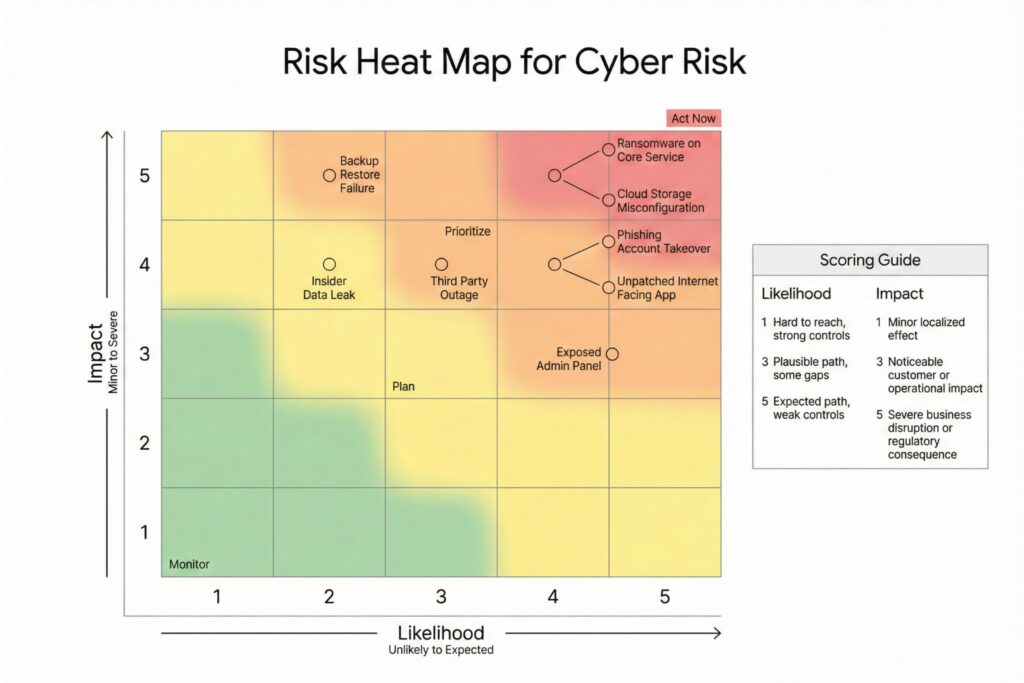
To make this real, add thresholds that your organization already uses. For impact, teams often anchor the rubric to outage classes, data classifications, and regulatory triggers. For likelihood, teams often anchor to internet exposure, required privileges, and presence of compensating controls such as strong authentication and network segmentation.
Inputs That Make the Map Reliable
A heat map becomes credible when inputs are curated and connected to ownership. You do not need every telemetry stream. You need the ones that change the score and explain why.
Inputs that tend to matter in cyber risk heat maps:
- Asset or service criticality tied to business services and data classification
- Exposure indicators such as internet reachability and administrative surface
- Vulnerability and configuration findings normalized by exploitability and reach
- Identity and access posture including privileged paths and authentication strength
- Control coverage for logging, detection, endpoint protection, and recovery testing
- Incident and near miss history, especially user driven and identity driven events
- Third party dependencies that can create shared blast radius
Keep each input tied to a named owner. If no one owns the asset inventory, likelihood scoring will drift. If no one owns recovery testing, impact scoring will become wishful thinking.
How to Build a Cyber Risk Heat Map in a Way People Trust
The build process should feel like a product workflow, not a quarterly ritual. Use a cadence that matches how quickly your environment changes.
- Define the scoring rubric and get sign off from cyber leadership and business owners
- Choose a unit of analysis that matches decisions, such as business service, application, platform, or site
- Score impact using business thresholds and a short written rationale
- Score likelihood using exposure, feasibility, and control strength indicators
- Plot items and review outliers with technical owners and risk owners
- Assign a default action per zone and name an accountable owner with a due date
Document assumptions in plain language. If an internet facing admin interface increases likelihood by one level, state it. If verified recovery capability reduces ransomware impact by one level, state it and define what verified means.
Avoid mixing incomparable objects. Strategic risks belong on a different map than individual vulnerabilities. If you need both, use one map for services and a separate operational view for vulnerability clusters.
Turning Red and Orange Into Work That Moves the Map
A heat map should function as a decision mechanism. Each zone needs default actions so teams do not invent a new process every cycle. Actions should target the dominant driver, either likelihood or impact.
| Zone | What it means | Default action that reduces cyber risk |
|---|---|---|
| Red | High likelihood and high impact | Executive visible remediation with time bounds, plus compensating controls where speed matters |
| Orange | High on one dimension | Target the dominant driver, either close exposure and harden identity or improve resilience and reduce blast radius |
| Yellow | Moderate risk | Schedule work or explicitly accept risk with review date and conditions |
| Green | Low risk | Monitor for movement and avoid spending scarce capacity unless it blocks higher value work |
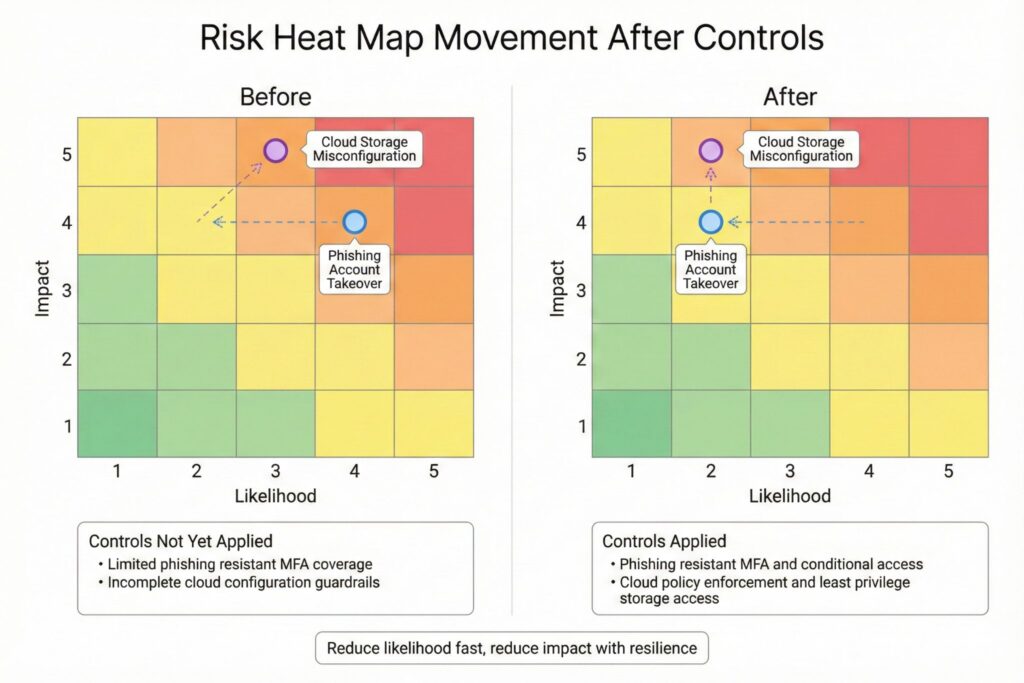
In practice, likelihood reducers are often faster. Closing unnecessary exposure, tightening authentication, reducing privileged paths, and adding isolation can shift a score quickly. Impact reducers often require deeper work. Recovery testing, segmentation, and dependency reduction move impact when done well. The heat map clarifies which side of the equation you must change.
Failure Modes That Break Heat Maps in Cybersecurity
Most failures are predictable. They come from ambiguity, politics, and unowned systems rather than math.
Common failure modes:
- Vague labels such as high and low with no thresholds teams can test
- Likelihood scored only from vulnerability severity while ignoring exposure and controls
- Impact scored only from asset type rather than business service and data sensitivity
- One map mixing service risk, third party risk, and individual vulnerabilities
- Ownership missing so decisions stall after the presentation
False precision is another trap. The difference between adjacent cells is often smaller than the debate around it. Treat the grid as a way to rank work, not as a measurement instrument.
If the red zone looks the same month after month, the map is giving you a signal. Either leadership is accepting cyber risk by default, or your remediation system cannot deliver change at the pace the environment demands.
Quality Checks That Make the Heat Map Executive Ready
Before you present the map, test whether it will withstand real questions and produce action.
Quality checks to run:
- Consistency check that similar services score similarly under the same rubric
- Traceability check that every score has a short rationale and a named data input
- Outlier check that top risks have owners, plans, and clear next actions
- Actionability check that each red item has a change that reduces likelihood or impact
- Stability check that score churn reflects real changes rather than scoring drift
Calibration and drift control
To keep scoring consistent over time, treat calibration as part of the operating rhythm, not an exception.
- Run short calibration sessions each cycle (30–60 minutes) with the same cross-functional group to compare a small sample of items and align on interpretation.
- Track cell distribution over time. Large swings usually indicate scoring drift, changes in inventory scope, or a shift in threat/exposure—not better math.
- Set clear rules for when a score may change: a documented change in exposure, feasibility, or verified control strength; a material change in business impact thresholds; or a confirmed incident/near miss that changes assumptions.
- Keep a lightweight change log for rubric definitions and anchors. When definitions change, note the effective date and apply changes consistently to avoid mixing old and new scoring on the same map.
Treat the rubric as a living artifact. Update it when the business changes, when major regulatory requirements land, or when your operating model shifts toward new cloud patterns and third party reliance. Keep the changes controlled and documented so trust grows rather than resets.
A Heat Map That Earns Its Place
A mature cybersecurity program uses the risk heat map to answer three leadership questions. What are the top risks right now. What is changing. What decision is required. When the map answers those questions without long explanation, it becomes an operational control and not a slide.
Build it around ownership, defensible scoring, and actions that move risk. That is how a cyber risk heat map becomes both people oriented and decision grade.
Frequently Asked Questions (FAQ)
Update it on the same cadence as leadership decisions, which is often monthly, and refresh sooner after major exposure changes, critical releases, or high-impact vulnerabilities. If the map is quarterly while the environment changes weekly, it will mislead.
Keep each map to comparable items such as business services, applications, or platforms with clear owners and measurable impact. Do not mix strategic enterprise risks, individual vulnerabilities, and third-party program risks on one grid because scoring and remediation are not comparable.
Base likelihood on exposure, feasibility, and control strength rather than severity labels alone. Internet-facing reachability, required privileges, exploit maturity, and identity controls usually explain likelihood better than CVSS by itself.
Define impact as business outcomes such as revenue loss, customer harm, regulatory consequences, contractual penalties, or material operational interruption. Use thresholds your organization already trusts, including outage tiers and data sensitivity classes, and factor in proven recovery capability.
Treat the grid as a ranking tool, not a calculation of truth, and require a short rationale for every score. If teams argue over adjacent cells, tighten definitions and improve inputs instead of debating the dot.
Leave a Reply