Cybersecurity leaders keep hearing the same challenge in different language. How much cyber risk are we carrying, which controls reduce it the most, and how confident are we in the answer.
Many teams still rely on maturity scores, heat maps, or a single ordinal rating that cannot be validated against outcomes. That approach breaks down when budgets tighten or when a business owner asks why one investment should outrank another.
The FAIR model changes the conversation by treating risk as probable loss expressed in financial terms. It breaks cyber risk into loss event frequency and loss magnitude, then makes uncertainty explicit so decision makers can see what is measured, what is inferred, and where better data would genuinely improve confidence.
When FAIR Quantification Pays Off
FAIR work delivers the most value when a decision is material, contested, or repeated. If a team is choosing between network segmentation that improves recovery and new detection content that improves visibility, quantification can settle the debate by showing which lever moves expected loss and which lever reduces tail exposure.
It is less useful for low cost choices where modeling overhead exceeds the value of the decision. In those cases, an agreed control standard or architecture principle is often sufficient.
Use quantification when the outcome changes a budget line, a product launch timeline, a contractual posture, or a board level statement of risk appetite. Those moments benefit from one unit of measure that allows comparison across very different cybersecurity options.
Scenarios That Stay Comparable
Many FAIR programs fail early because the first scenarios are too broad. When a scenario bundles multiple assets, threat communities, and outcomes, every input becomes a debate and every debate becomes political.
A scenario works when two analysts interpret it the same way and when an accountable owner can approve mitigations that change it. It also helps when the scenario is written so an incident responder could recognize it in telemetry, and a finance partner could map it to cost categories without guesswork.
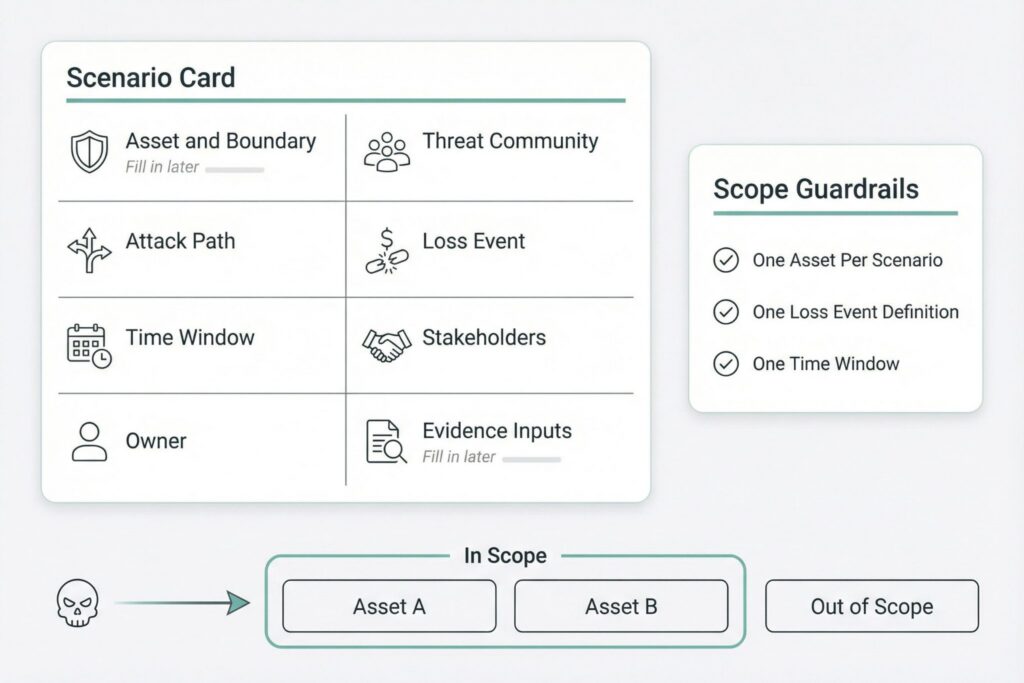
Table 1 provides a compact template that stays readable while preventing scope creep.
| Scenario Element | What to Capture | Example Level of Detail |
|---|---|---|
| Asset and boundary | What is at risk and where it lives | Specific platform tenant, environment, or service |
| Threat community | Who can cause harm | External criminals, insider misuse, supplier compromise |
| Attack path | How loss begins | Credential theft, exposed admin interface, malicious update |
| Loss event | What must happen to count as loss | Data exfiltration confirmed, service unavailable beyond threshold |
| Time window | Period for frequency and budgeting | One year for board reporting, one quarter for program planning |
| Stakeholders | Who reacts and can create secondary loss | Customers, regulators, partners, investors |
Start with three to five pilot scenarios that differ in control levers and business impact. Include at least one identity driven scenario, one availability scenario, and one third party scenario so the program does not get dismissed as ransomware accounting.
Loss Event Frequency You Can Defend
Loss event frequency is not the same as threat activity. It reflects how often harmful actions lead to actual loss in your environment over a defined time window.
A practical decomposition separates how often a threat acts in a way that could cause loss from how often those actions succeed. In FAIR terms, teams often approximate this using threat event rate and susceptibility, then refine over time as measurement improves.
Credibility comes from evidence and honest ranges. You rarely get perfect measurement, but you can build defensible estimates from observed rates, asset exposure signals, and control performance indicators. When evidence is weak, the right response is wider uncertainty, not forced precision.
Table 2 maps common frequency inputs to data that many security programs can obtain with reasonable effort.
| Frequency Input | Evidence That Tends to Exist | Typical Owners |
|---|---|---|
| Threat event rate | Email security counts, scanning and probing volume, credential stuffing hits, endpoint detections | SOC, threat intelligence |
| Asset exposure | Internet facing inventory, third party connectivity, privileged role footprint, user interaction surfaces | IT, cloud platform, IAM |
| Susceptibility drivers | MFA coverage, phishing resistant authentication coverage, patch latency, configuration drift, EDR coverage, segmentation gaps | Security engineering, IT |
| Response friction | Time to detect and contain, playbook quality, privileged session controls, monitoring coverage | SOC, incident response, IAM |
Two practices keep frequency estimates from turning into opinion. Record the proxy used for each input and why it represents the factor in your environment. Then separate measured rates from inferred ones in your working notes, and widen ranges where judgment is doing most of the work.
Loss Magnitude That Finance Can Audit
Loss magnitude should reflect what your organization would actually spend or forgo if the loss event occurs. Public breach headlines can provide context, but they cannot substitute for internal baselines because contractual terms, architectures, and operating models vary widely.
Magnitude work becomes manageable when you align to finance friendly loss forms and avoid double counting.
Downtime cost and lost revenue are not interchangeable. Many outages create productivity loss and recovery spend without producing proportional revenue loss, especially in business to business settings with annual contracts and service credits.
Secondary loss is where models often lose trust. Customer reactions, regulator actions, and partner claims do not occur in every event. Treat secondary effects as probabilistic, and write down the trigger conditions that make them more likely, such as specific data types, jurisdictions, notification thresholds, or contractual penalty clauses.
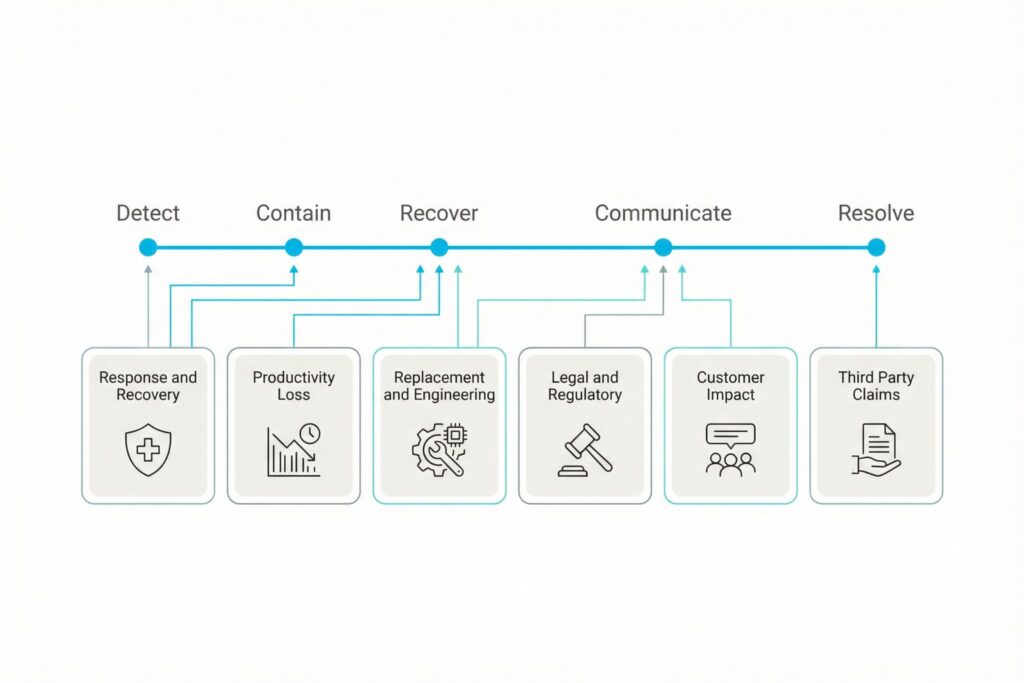
A consistent set of loss forms that works across many cyber scenarios is shown below.
| Loss Form | What It Covers in Cybersecurity | Common Internal Inputs |
|---|---|---|
| Response and recovery | Investigation, containment, rebuild, overtime, specialist support | Incident response labor rates, retainer terms, service desk history |
| Productivity loss | Work disruption, manual processing, degraded service | Business continuity estimates, operational dashboards |
| Replacement and engineering | System replacement, accelerated redesign, tooling changes | Project cost baselines, architecture roadmaps |
| Legal and regulatory | Counsel effort, reporting, penalties where applicable | Legal rates, reporting obligations, prior matters |
| Customer impact | Credits, churn risk, delayed sales, contract loss | Customer success metrics, contract terms, finance models |
| Third party claims | Partner remediation costs, disputes, indemnification | Supplier contracts, procurement records |
How to Run FAIR Workshops
FAIR inputs improve when workshops are structured, time boxed, and anchored in concrete artifacts. Bring telemetry summaries, control coverage reports, incident timelines, and service availability metrics into the room. Avoid asking people to estimate in a vacuum.
Use calibrated ranges rather than single numbers. A simple approach uses low, most likely, and high values with a short note on what would need to be true for the high end to occur. Over time, replace debated ranges with measured rates, and narrow uncertainty only when measurement stays stable across reporting cycles.
Keep a short assumptions ledger per scenario. It should capture what changed since the last run, which inputs were updated, and whether new evidence narrowed or widened uncertainty. That log becomes the backbone of trust when leaders ask why results moved.
Running FAIR Across Teams
Quantification fails when it is owned only by a risk analyst. FAIR work is an integration task across security operations, IAM, infrastructure, legal, and finance. Each function holds a piece of evidence, and each should be accountable for keeping that evidence current.
Define roles early and keep sessions short. A common rhythm uses one session to lock scenario boundaries and data sources, then a second session to review ranges, validate top drivers, and confirm results are not hypersensitive to minor inputs.
Use the checklist below to keep the workflow consistent:
- Confirm the scenario boundary and time window
- Assign an accountable owner for each key input proxy
- Record ranges and the evidence behind them
- Run a sensitivity check and identify top drivers
- Produce a decision summary and a rerun date
Decision Outputs Leaders Actually Use
Leaders rarely need the full model. They need a concise answer on the baseline risk, the effect of an investment, and the confidence level.
A decision ready output should show expected loss and upper tail exposure as ranges, identify the few drivers that explain most of the result, and link each driver to a concrete mitigation lever. It also helps to define success in operational terms, such as coverage targets, reduced time to contain, or improved recovery verification.
Table 3 outlines a one page structure that works well for executive risk reviews.
| Section | What the Reader Should Learn |
|---|---|
| Scenario statement | What loss event is being quantified and within what period |
| Baseline loss view | Expected loss and upper tail exposure expressed as ranges |
| Key drivers | The few inputs that explain most of the result |
| Control options | Which changes reduce frequency, which reduce magnitude |
| Impact of the change | How tail exposure shifts after the proposed control |
| Ownership and cadence | Who owns the control and when the scenario will be rerun |
If quantification does not change a decision, the scenario is likely too broad, the drivers are unclear, or the mitigations do not target the drivers. Refining scope and rerunning usually adds more value than adding narrative.
Quality Checks for FAIR Analysis
A strong FAIR practice includes lightweight quality gates. Start with consistency checks, then add deeper tests as the program matures.
Table 4 lists checks that help teams catch common failure modes without slowing delivery.
| Check | What It Detects | What to Do If It Fails |
|---|---|---|
| Boundary check | Scenario mixes multiple assets or outcomes | Split into separate scenarios |
| Double counting check | Same loss counted in two forms | Reconcile financial logic and window |
| Driver check | Too many drivers matter equally | Rework inputs and clarify causality |
| Sensitivity check | Small changes swing results wildly | Re examine ranges and proxies |
| Reality check | Output contradicts known incident history | Validate assumptions and exposure |
These checks build trust because they enforce discipline. They also reduce the risk that quantification devolves into spreadsheet arguments rather than decision support.
What Derails FAIR Programs
The most common failures are operational. One trap is treating FAIR outputs as a scoreboard for teams. When numbers become punitive, people will game assumptions and the organization will lose transparency.
Another trap is buying tooling before scenarios, owners, and cadence exist. Tools can improve repeatability, but they cannot fix unclear boundaries or missing accountability.
A final trap is reporting a single number without tail exposure. Cyber loss is asymmetric, and boards often care more about the upper range than the average. A range that makes uncertainty visible is more trustworthy than a point estimate that implies certainty.
FAIR quantification can make cyber risk legible to business leaders, but only if the practice is executed with discipline. Clear scenarios, auditable inputs, explicit uncertainty, and outputs that map directly to cybersecurity decisions turn quantification into an operating capability rather than a one off exercise.
Frequently Asked Questions(FAQ)
FAIR is most useful when the choice is expensive, disputed, or repeatable. It works well for decisions that change a budget line, alter a launch timeline, or set a board level risk appetite.
You need a tightly scoped scenario, a time window, and defensible ranges for frequency and magnitude. Use whatever evidence already exists, such as control coverage reports, incident timelines, exposure inventory, and response metrics, then widen ranges where judgment dominates.
Start with three to five scenarios.
Use ranges and explain what makes the low end plausible and what must be true for the high end to occur. Separate measured inputs from inferred ones in your working notes. Track changes between runs in a short assumptions ledger so leaders can see why confidence increased or decreased. Tighten ranges only when the underlying measurements stay stable across cycles.
Rerun on a set cadence that matches the decision cycle, then rerun early when the scenario drivers materially change. Triggers include major control rollouts, architecture changes, new third party connections, shifts in privileged access footprint, or incident learnings that change exposure or response performance.
Treat it as a boundary or assumption problem first. Recheck scenario definition, exposure signals, and whether you accidentally modeled multiple outcomes in one scenario, then revisit the largest drivers and their proxies.
Define each loss form so costs fit in only one place for the chosen time window. Align categories to how finance books costs, then walk through an event timeline and assign each cost once, especially where downtime, productivity loss, and revenue impact can overlap.
Leave a Reply