
Author: Nora Belfield, GCTI — Senior Threat Intelligence Analyst, 9 years of experience tracking advanced persistent threat groups and translating raw intelligence into actionable risk context for security operations teams.
Consultant: Sandra Okafor, CISSP — certified information systems security professional and vulnerability management program lead with experience designing risk-based prioritization frameworks for mid-sized and enterprise organizations.
Vulnerability management decisions in production environments should involve qualified security professionals. Nothing here constitutes specific remediation advice for your organization’s infrastructure.
A scanner runs, returns 400 critical vulnerabilities, and a security team has to decide where to start. The Common Vulnerability Scoring System (CVSS) — a framework that rates the technical severity of software flaws on a scale from 0 to 10 — has been the default triage tool for years. CVSS does what it was built to do: describe how dangerous a vulnerability could be in theory. It was never designed to tell you whether attackers are actually trying to exploit it right now.
That is the gap the Exploit Prediction Scoring System, or EPSS, was built to fill.
What CVSS leaves out
CVSS scores a vulnerability’s technical characteristics — how it can be reached, what access it requires, and what could go wrong if exploited. Those are legitimate and useful things to know. The problem is that severity in theory correlates poorly with activity in the real world.
Research from the Kenna Security and Cyentia Institute Prioritization to Prediction series found that fewer than 2 percent of published CVEs — Common Vulnerabilities and Exposures, the standardized identifiers assigned to known flaws — are ever exploited in the wild. In any given year, thousands of newly published CVEs receive a CVSS score of 7.0 or higher. A team that treats every one of those as equally urgent will burn through its patching capacity on vulnerabilities that pose no real threat while something actively dangerous waits in the queue.
The hospital case makes this concrete. A security team working through a backlog of 400 critical-severity CVEs has no rational starting point without exploitation data. Filtered through EPSS, that same list would typically yield somewhere between 10 and 30 CVEs with a meaningful probability of active exploitation — a number a team can actually act on within a sprint cycle.
How EPSS calculates exploitation probability
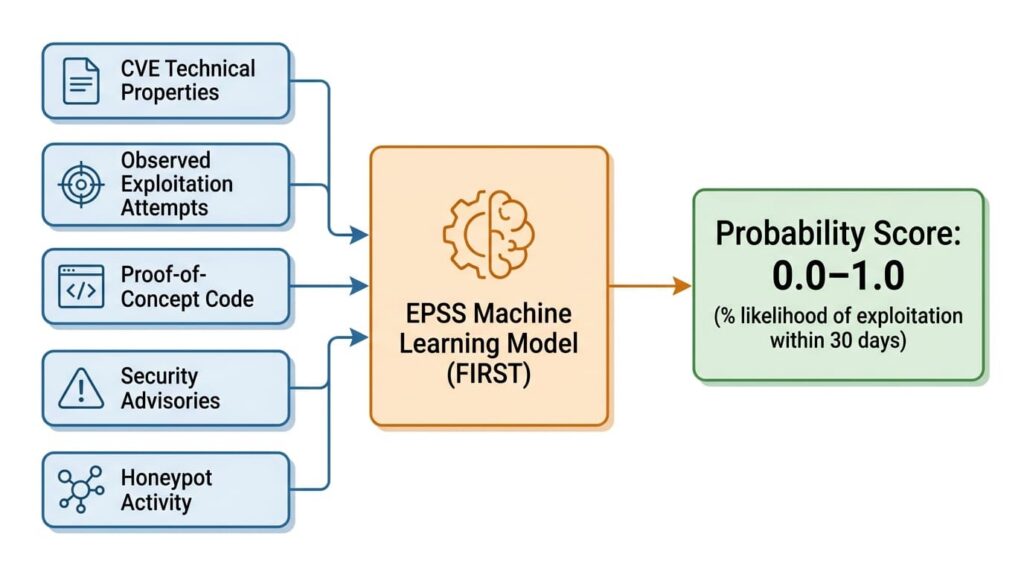
EPSS is developed and maintained by FIRST, the Forum of Incident Response and Security Teams. It produces a probability score between 0.0 and 1.0 — expressed as a percentage — representing the likelihood that a given CVE will be exploited in the wild within the next 30 days.
The model draws on each CVE’s technical properties and combines them with threat intelligence from observed exploitation attempts, proof-of-concept code availability, mentions in security advisories, and activity logged across honeypots and detection infrastructure.
EPSS version 3, released in 2023, substantially improved predictive accuracy and made the methodology significantly more transparent, including publishing precision and recall metrics against held-out test data (FIRST).
The scores measure different things, and both can be true at the same time. CVE-2022-30190, the Microsoft Support Diagnostic Tool flaw known as Follina, is a useful illustration. Its CVSS score was 7.8 — serious, but not in the critical tier. Its EPSS score spiked above 0.97 within days of public disclosure when multiple threat actors began exploiting it actively. A team relying on CVSS alone would have ranked it below dozens of 9.x-scored vulnerabilities that nobody was touching.
Reading EPSS scores in practice
EPSS scores are publicly available through FIRST at no cost and are updated daily. That update cadence matters — but the way most teams use it is too passive. Checking a score once and treating it as stable misses the most actionable signal EPSS produces.
Score vs percentile
FIRST publishes two numbers for each CVE: the raw probability score and a percentile ranking showing where that CVE sits relative to all others currently in the model. These are not the same thing, and confusing them leads to miscalibrated triage. A CVE with an EPSS score of 0.15 might sit in the top 3 percent of all scored vulnerabilities — because the vast majority of CVEs carry scores below 0.01. That context changes how urgently 0.15 should be read. When setting thresholds, teams should look at both numbers: the raw score tells you the probability, and the percentile tells you how that probability compares to the current threat landscape.
Trend over time
A CVE whose score rises from 0.03 to 0.40 over seven days is more meaningful than one that has sat at 0.40 for months. The upward movement signals that new exploitation activity or proof-of-concept code has entered the threat intelligence feeds the model draws on — and that the window for remediation is narrowing. Mature vulnerability management programs track EPSS trajectories, not just point-in-time values. Most platforms that surface EPSS natively can be configured to flag significant week-over-week score increases as a separate alert tier.
For the threshold that defines meaningful risk, FIRST’s own usage guidance points to the top decile of scored CVEs as a practical cutoff — in the current v3 model, that corresponds to roughly EPSS ≥ 0.1. Teams that use 0.5 as their threshold are being more conservative, which may suit certain risk environments, but they risk missing CVEs in the 0.1–0.49 range that are actively exploited across the broader threat landscape.
Where EPSS has real limits
EPSS is a probabilistic model. A score of 0.05 means exploitation is less likely relative to other CVEs — not that it cannot happen. Organizations in high-value sectors, including finance, healthcare, and critical infrastructure, face more targeted attack activity than the general threat population the model is trained against. For these environments, CISA’s Known Exploited Vulnerabilities catalog — updated continuously with flaws confirmed to be actively exploited — is an essential complement to EPSS (CISA).
Niche or proprietary software generates thinner threat intelligence, which makes EPSS predictions less reliable for those CVEs. Zero-day vulnerabilities — those being exploited before a CVE identifier is assigned — fall entirely outside what the model can see. In both cases, vendor-specific advisories and manual review carry more weight.
EPSS also has no visibility into your specific environment. Whether a vulnerability is exposed on your network, whether compensating controls are already in place, and whether the affected system is internet-facing all change its real-world risk. Exploitation probability across the general threat landscape is a starting point, not a final answer.
Adding EPSS to your vulnerability workflow
Vulnerability management programs that rely solely on CVSS are treating severity as a proxy for risk. EPSS offers a practical correction — one that does not require replacing existing tools. Most major vulnerability management platforms, including Tenable, Qualys, and Rapid7, surface EPSS scores natively. For teams using manual spreadsheet-based triage, FIRST provides a free daily score file and an API. Teams on older platform integrations should verify they are pulling EPSS v3 scores rather than v2, as the schema changed with the 2023 model release.
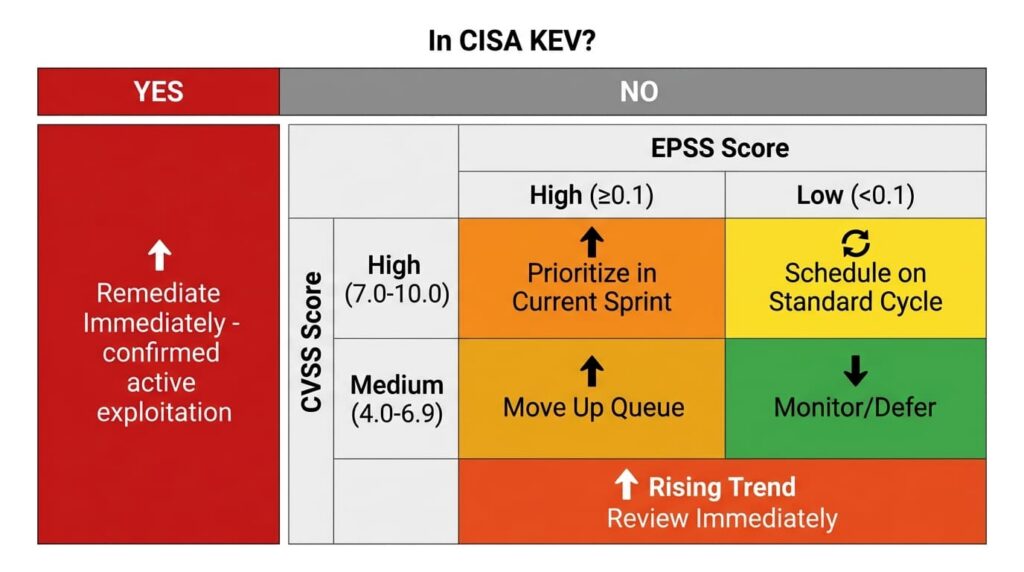
The table below combines all three signals into a single decision framework. KEV status takes precedence over everything else — a confirmed exploitation record is ground truth, not a prediction.
| In CISA KEV | CVSS | EPSS | Recommended action |
|---|---|---|---|
| Yes | Any | Any | Remediate immediately — confirmed active exploitation |
| No | High (7.0–10.0) | High (≥ 0.1, top decile) | Prioritize in current sprint |
| No | High (7.0–10.0) | Low (< 0.1) | Schedule on standard cycle |
| No | Medium (4.0–6.9) | High (≥ 0.1, top decile) | Move up the queue regardless of CVSS rank |
| No | Medium (4.0–6.9) | Rising trend | Review immediately — watch for KEV addition |
| No | Any | Low (< 0.1), stable | Monitor, defer, or formally accept the risk |
A reasonable starting point for teams new to this: run a single filtered export of your current backlog at EPSS ≥ 0.1, cross-reference it against the KEV catalog, and compare what you get against your existing CVSS-sorted priority list. The gap between the two lists is usually more instructive than any methodology document. Sandra Okafor, whose consulting work with mid-sized organizations informs this article, recommends that exercise as the fastest way to build internal confidence in EPSS-based prioritization before formalizing it into a workflow.
For organizations without dedicated security staff, a managed security service provider can configure EPSS-informed triage within a broader vulnerability management program. The goal is a consistent, repeatable process — one your team can actually execute each sprint cycle rather than revisit from scratch each time a scanner report lands.
CVSS tells you the severity of a flaw. EPSS tells you whether attackers have found it worth their time. Tracking both — and watching how EPSS scores move over days, not just what they read at scan time — consistently narrows the list of things that actually need to move fast.
Frequently Asked Questions
CVSS rates the technical severity of a vulnerability — how it can be reached, what access it requires, and what damage it could do. EPSS predicts the probability that someone will actually exploit it within the next 30 days. One describes potential; the other describes likely behavior. They answer different questions and are most useful when read together.
The score is the raw probability of exploitation within 30 days. The percentile shows where that CVE stands relative to every other vulnerability currently in the model — and because most CVEs score below 0.01, even a score of 0.15 can place a flaw in the top few percent of the entire dataset.
Daily. A score doubling or tripling within a week typically means new exploit code has surfaced or an active campaign has started — and that window for remediation is closing.
FIRST’s guidance points to the top decile of scored CVEs as a practical high-risk cutoff — in the current v3 model, that corresponds to roughly EPSS ≥ 0.1. Teams with constrained patching capacity sometimes raise that threshold, but doing so risks missing CVEs with real exploitation activity in the 0.1–0.49 range. If you are just starting out, run a filtered export at ≥ 0.1 and compare what you get against your existing CVSS-sorted list — the gap between the two is usually instructive enough to justify the threshold before you formalize anything.
No — low means less likely relative to other CVEs, not impossible. Scores change as new threat intelligence accumulates, so a reading worth ignoring today may not be worth ignoring next week.
Leave a Reply